
Out of the box and into the cloud, immediately
With MX, connectivity isn't an add-on. We've embedded it into the hardware so that it automatically connects and reports to the cloud (and a free local app) the moment it receives power.
Get all the benefits of connectivity, including remote asset management, system alerts, and data, without any extra work or equipment.
Every MX system ships with 3 years free remote connectivity.
And the MX Field App™, which provides local system access from any
smartphone, is free forever.

- Out-of-the-box connectivity
- System alerts (email/text)
- Remote asset management with GPS map view
- ...and more

- Remote programming
- Knockdown alerts
- Data charting
- ...and more

- Remote scheduling
- 5-year historical data and export functionality
- ...and more


MX System Features

Free Connectivity
Systems come with built-in connectivity and three years free.

Actionable Alerts
Receive timely email/text alerts about your MX systems.

Remote Scheduling
Create, delete, and adjust schedules, individually and in bulk.
Free Connectivity
Systems come with built-in connectivity and three years free.
Actionable Alerts
Receive timely email/text alerts about your MX systems.
Remote Scheduling
Create, delete, and adjust schedules, individually and in bulk.

MX Cloud™
Access system status, settings, and data from anywhere.

MX Field App™
Quickly set up and make changes with iOS/Android app.

Easy Installation
Embedded connectivity is factory tested and works out of the box.
MX Cloud Software
Access system status, settings, and data from anywhere.
MX Field App
Quickly set up and make changes with iOS/Android app.
Easy Installation
Builtin connectivity is factory tested and works out of the box.

For more than 20 years, cities have trusted Carmanah to provide them with safe, efficient, and sustainable transportation solutions. Now, we're ready to usher them into the future with an innovative line of affordable, easy-to-use connected products.

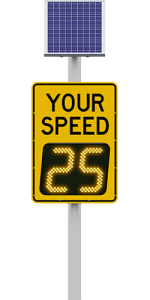
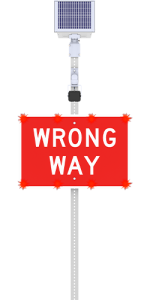
More Popular Systems


"Carmanah has the best equipment we have used so far. They deserve a lot of credit for making the RRFB enhanced crosswalk available across the USA."
- Bill Baranowski, PE, City Traffic Engineer, West Jordan, UT
"Carmanah has the best equipment we have used so far. They deserve a lot of credit for making the RRFB enhanced crosswalk available across the USA."
- Bill Baranowski, PE, City Traffic Engineer, West Jordan, UT
Latest News